How visualizations can make your data processing more effective

Content
Intent:
What are the benefits of data visualizations for your data management strategy and why is it so importantDedicated to:
- Managers
- Engineers
- Manufacturers
- Data scientists
- Product owners
- Research and Development (R&D)
Key Questions?:
- Why are visualizations so important?
- What are the benefits of visualization?
- What is data and process visualization?
- What business processes can you visualize?
- Why do we need data visualizations incorporated in our business processes?
Humans are attracted visualizations
Our eyes are drawn to colors and patterns. We can quickly identify red from blue, square from circle. Our culture is visual, including everything from art and advertisements to TV and movies. Data visualization is another form of visual art that grabs our interest and keeps our eyes on the message. People are visual learners and our brain is programmed for visualization, when we see a chart, we quickly see trends and outliers. If we can see something, we internalize it quickly. It’s storytelling with a purpose. If you’ve ever stared at a massive spreadsheet of data and couldn’t see a trend, you know how much more effective a visualization can be.
Data Everywhere
Now, there's more data than ever before and its gathering has become a vital part of the business processes. From sales, project management, to marketing and HR, and all the way to billion dollar energy, healthcare, manufacturing, and fossil sectors, where data is a key component in business efficiency. In each and every business sector there are numerous sources that are constantly collecting data. For example, in healthcare, various devices collect data from patients to monitor and display the information to doctors or nurses on the screens. The visual representation of that collected data is an essential part of making this process smooth and without any interruptions or incomprehensions. In manufacturing, data can be gathered from various types of variable costs, successful orders or number of defective items, all of which occur while in the process of manufacturing. Simply put, just a result or outcome is not enough to get an informative overview of an action or see a trait in its effectiveness. Deep knowledge of a process is derived from data processing and insights.Success Story of Energy Grid Data Visualization, Monitoring and Control
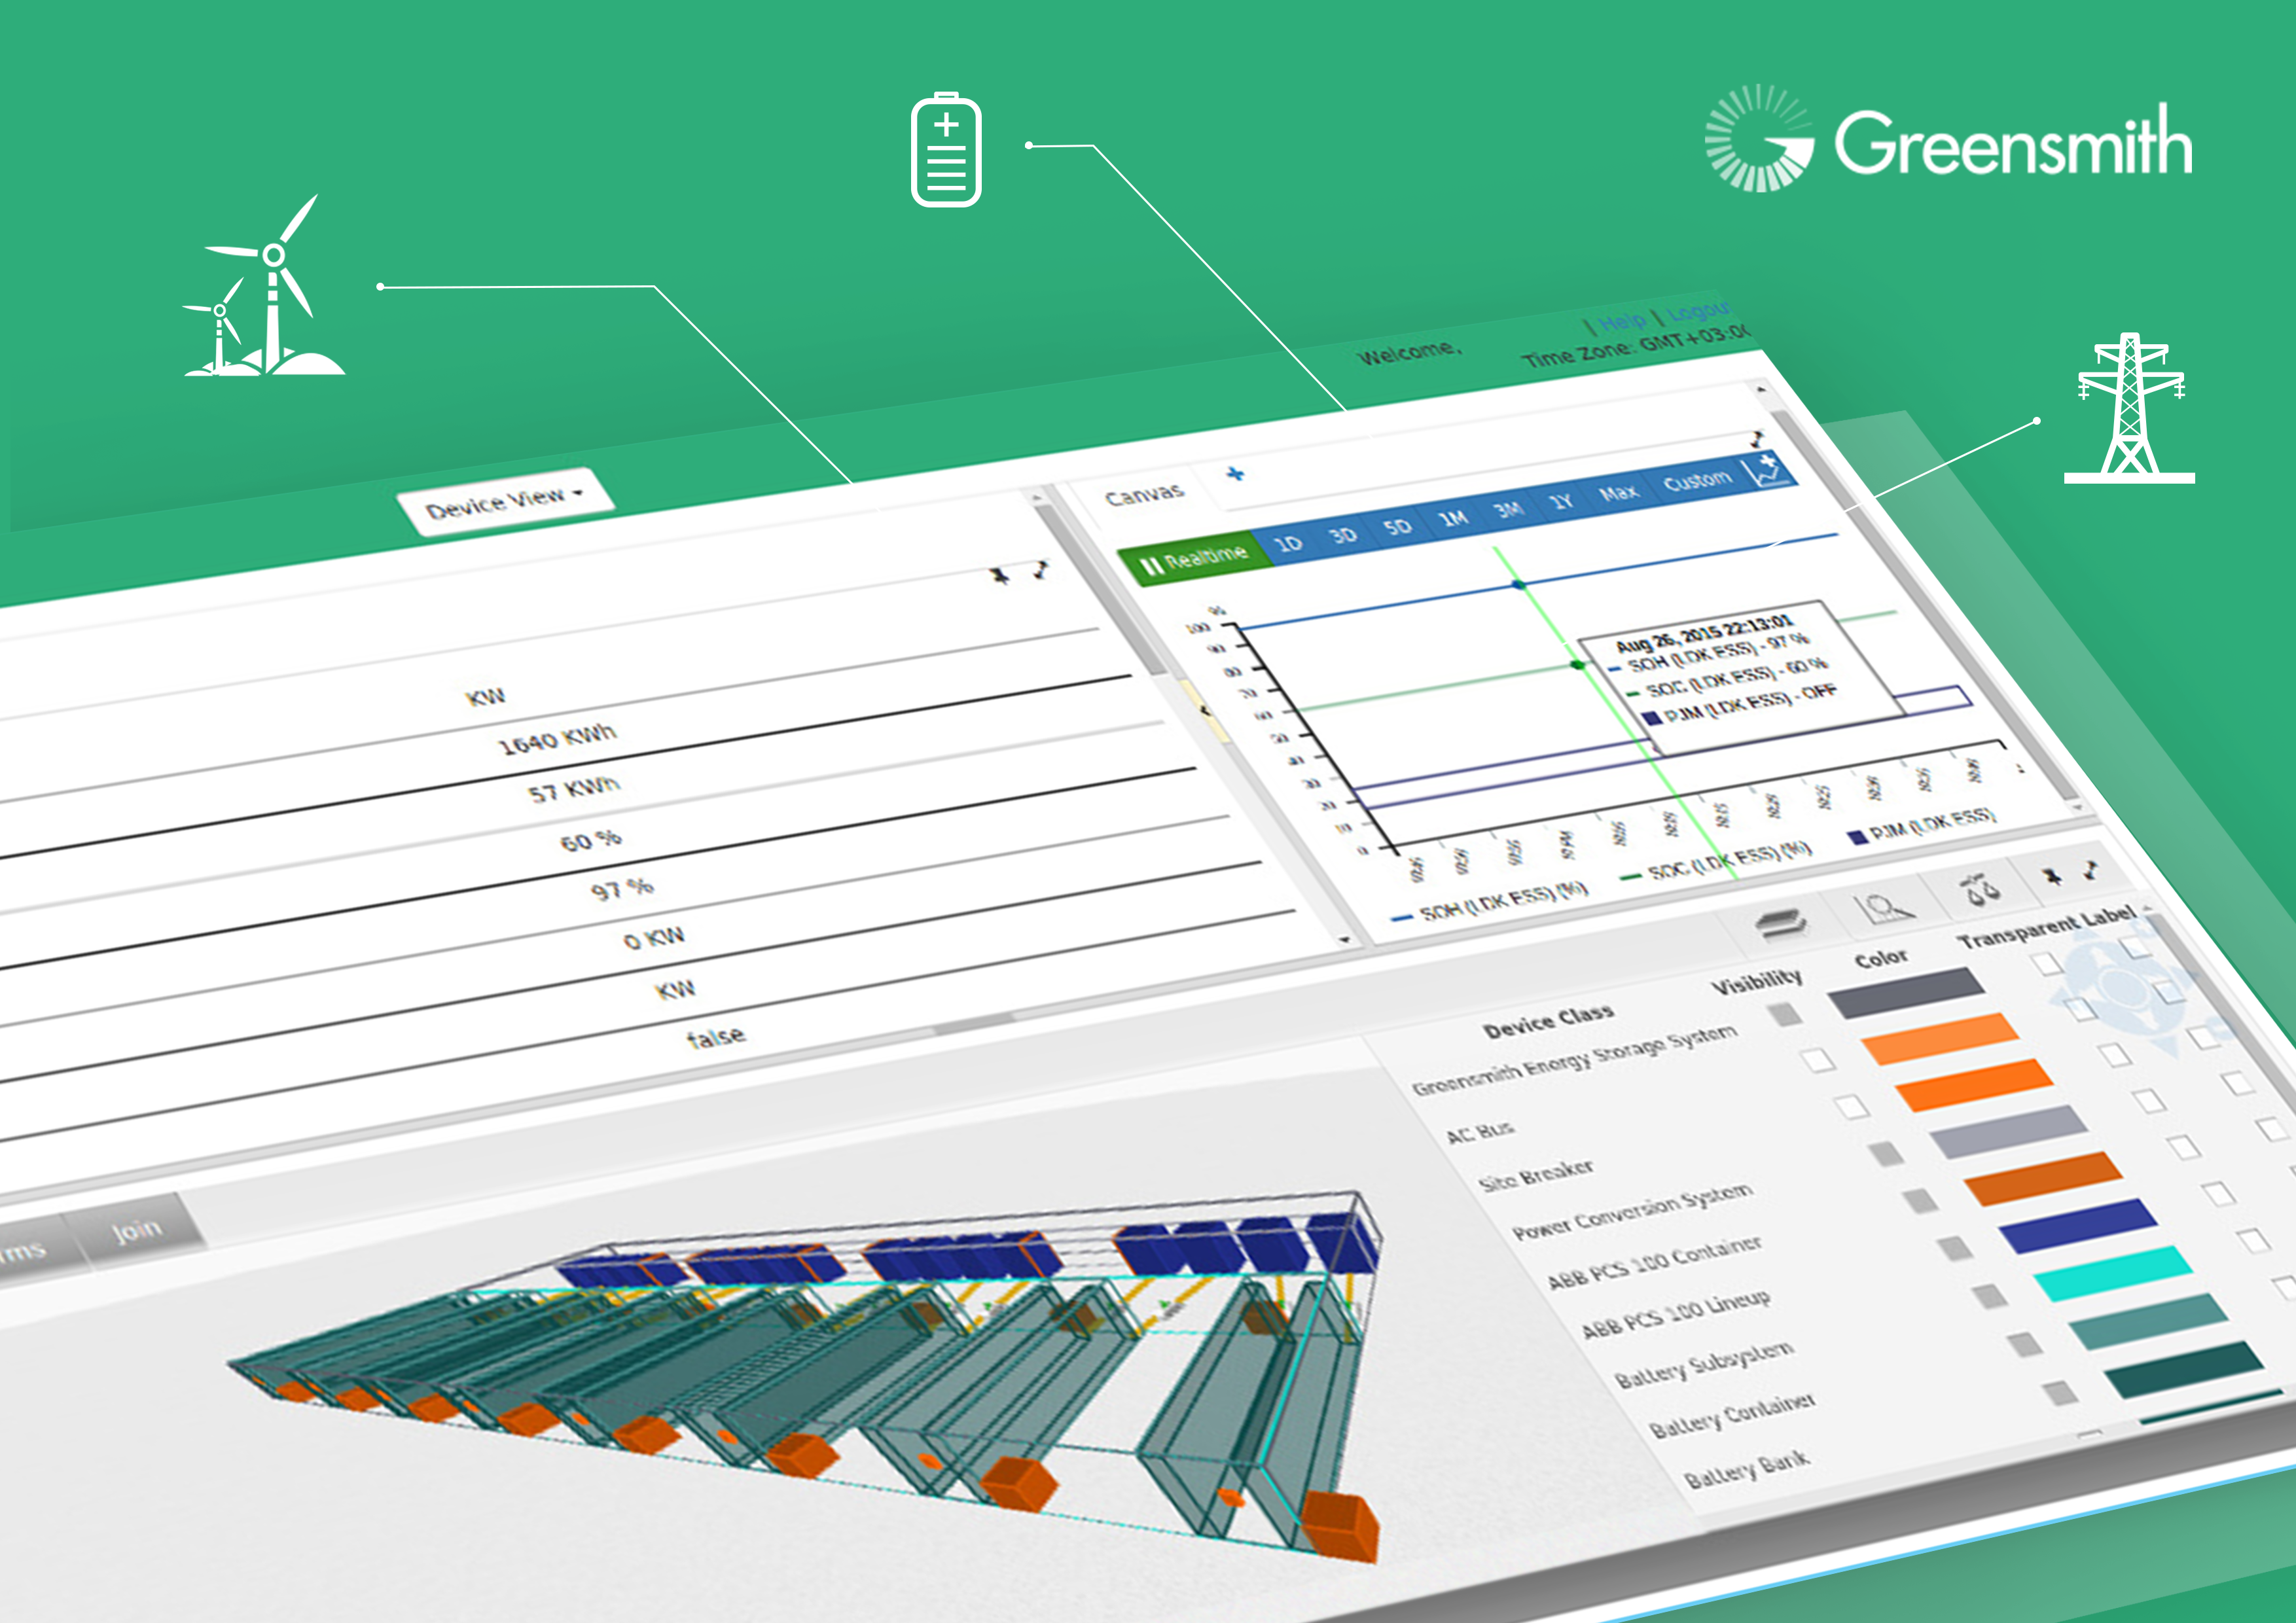 Greensmith Energy Management Systems is the leading provider of intelligent energy storage software and integration services in the United States. They design and deploy the world’s most advanced energy storage systems. From grid-scale to behind-the-meter and microgrid solutions, the Greensmith GEMS software platform optimizes the performance of energy storage by lowering costs and maximizing system return on investment. Greensmith Energy partnered with Indeform to design and implement a subsystem for custom energy storage data visualization, monitoring and control. By utilizing interactive 3D Web visualizations of devices, modules and connections, we cooperatively worked on real-time states of grid energy storage. By the same token, we worked on implementing the monitoring of alarms and warnings and on a system for data visualization and control. We enhanced data management with control of data layers, color coding, data comparison and introduced visualizations of different states and parameters of devices, such as currents, voltages and temperatures of the accumulation batteries. By implementing interactive customized multichannel 2D data plotting and comparison, we facilitated decision-making, efficiency analysis, monitoring and data management in different ranges of time and date.
Perception of Data Has Changed
Advances in technology have caused us to change our preconceived notions surrounding data presentation. What we once saw as dull and mundane, can now be seen as beautiful. Data visualization tools make it quick and easy to create charts and graphs which can be added to a customizable dashboard. Besides looking beautiful, data visualization tools give us the ability to process information faster and to use that information to boost productivity and results. Because of the graphic representations, it’s easy to see where action can be taken to improve. Let’s take the sales pipeline as an example, it can be illustrated with graphics to make it easy to see where deals fall and using data visualization to communicate information faster than with traditional reports. A more concise, more refined language, visualized data can be easily sorted to show a quick overview of whatever information is needed.It Makes Business Processes Much Smoother
No matter what business you are in, perception of data and the use of visualizations in data science can make your business processes much smoother. Data visualization is important for almost every career. It can be used by teachers to display student test results, by computer scientists exploring advancements in artificial intelligence (AI) or by executives looking to share information with stakeholders. It also plays an important role in big data projects. As businesses accumulated massive collections of data during the early years of the big data trend, they needed a way to quickly and easily get an overview of their data. Visualization tools were a natural fit. Visualization is central to advanced analytics for similar reasons. When a data scientist is writing advanced predictive analytics or machine learning (ML) algorithms, it becomes important to visualize the outputs to monitor results and ensure that models are performing as intended. This is because visualizations of complex algorithms are generally easier to interpret than numerical outputs.Decision-Making-Process
A common occurrence is when businesses have a lot of valuable data and a way of collecting it, but have a lack of tools and solutions in making it work for them in a sense of bringing value back to the company. Data science has become a number one priority when talking about increasing process efficiency, management, decision-making-process, monitoring and control. Quick and easily perceived information is crucial in a fast paced strategic environment. Employees have to get a clear understanding of the statistics derived from data and to have a possibility of easily transferring that information to managers and so on. When data is transformed to information with the modern solutions and as it moves its way up the decision-making-process funnels at ease - quick, reflective, strategic, and insightful business resolutions begin to be constructed.Understand your data
No matter the business area you are in, the process of communication is an essential part when we are justifying our decisions, explaining or exchanging information, insights, or monitoring processes. A good overview of our data, using the aid from modern technologies, grants us an ability to communicate effectively and transmit the information easily. Processing of complex data lets us get better insights on our day-to-day processes, see where they can be improved and make healthier strategic initiatives. In other words, we can get a deeper understanding with whom we are working with, refine our approach, and analyze the outcomes more effectively.